COURSE PROJECT
User Research Method Exploration
Collaborators
Kavya Iyer
Briana Chen
Kyle Chen
Jean Park
Zhichun Zhao
Timeline
12 weeks
Skills
User Research Methods
Visual Design
Tools
Figma
Miro
What I Worked On
As part of our User Centered Research Methods class, the overall goal of this project was to use various research methods to understand and evaluate the concept of “everyday algorithm auditing”: whether and how we can empower and incentivize everyday users to uncover harmful algorithmic biases in AI systems and assist AI/ML teams in addressing these issues. Based on our research, our team chose to focus our project on helping Instagram users solve the problem of insufficient control over their feed content—and consequently mitigating algorithmic bias—by designing a feed customization feature to allow them to better control their recommendations.
Design Process
Ideating
Think-aloud protocol
Reframing Ideas
Research
Journal Studies
Contextual Interviews
Survey
Speed Dating
Storyboards
Design
Paper prototype
Validation
User testing via prototype
Revision
Hi-fi prototype
Ideating
Think Aloud Protocol
We began by independently looking for evidence of algorithmic bias in various social media platforms that we were each familiar with to understand how wide the scope of the problem really was. Each of us discussed our initial findings, and found that a major issue across all the platforms was a lack of transparency regarding the content and advertisements displayed to users. We decided to explore this idea further by conducting a think-aloud protocol to understand how users interact with ads on a platform like YouTube and its existing transparency and report mechanisms. This process involved asking our participants to use the system while continuously thinking out loud, essentially simply verbalizing their thoughts as they move through the user interface.
Our group conducted think-alouds with 2 representative users each (5 members = 10 total users interviewed). We consolidated our high-level findings into a document and grouped them into 3 Usability Testing Findings that explored common themes, implications, and future steps for uncovering algorithmic bias in ads through video-centered social media platforms.
In summary, our usability testing found that:
Existing reporting mechanisms on YouTube are intuitive.
Most people are apathetic toward advertisements.
Lack of transparency surrounding advertisement methods.
Reframing Ideas
At this point, we needed to begin narrowing in on a specific need within the project space, and defining our focus and research goals. We started this process with a reframing activity: Reverse Assumptions, that essentially involved exactly what the name entailed. Our group chose this activity, pertaining specifically to social media platforms because we realized that the realm of social media carries deeply-integrated assumptions (especially within the younger generations that have grown up using it) that may play into new design ideas related to algorithmic bias. To address this, we wanted a simple activity that was powerful enough to flip our perspectives as researchers who identify with this group of users.
Before we began the reframing activity, we practiced “Walking the Wall” (found on this Miro board) from all of the independent research we had done on separate social media platforms to generate some general assumptions to start with.
Our team then created a separate Miro board and posted stickies exploring our current assumptions (pink) as well as the reversals of those assumptions (orange). From these reversals, we thought about how, with the new reversed assumptions, we could still accomplish the goal of mitigating algorithmic bias on social media (which we posted as green stickies).
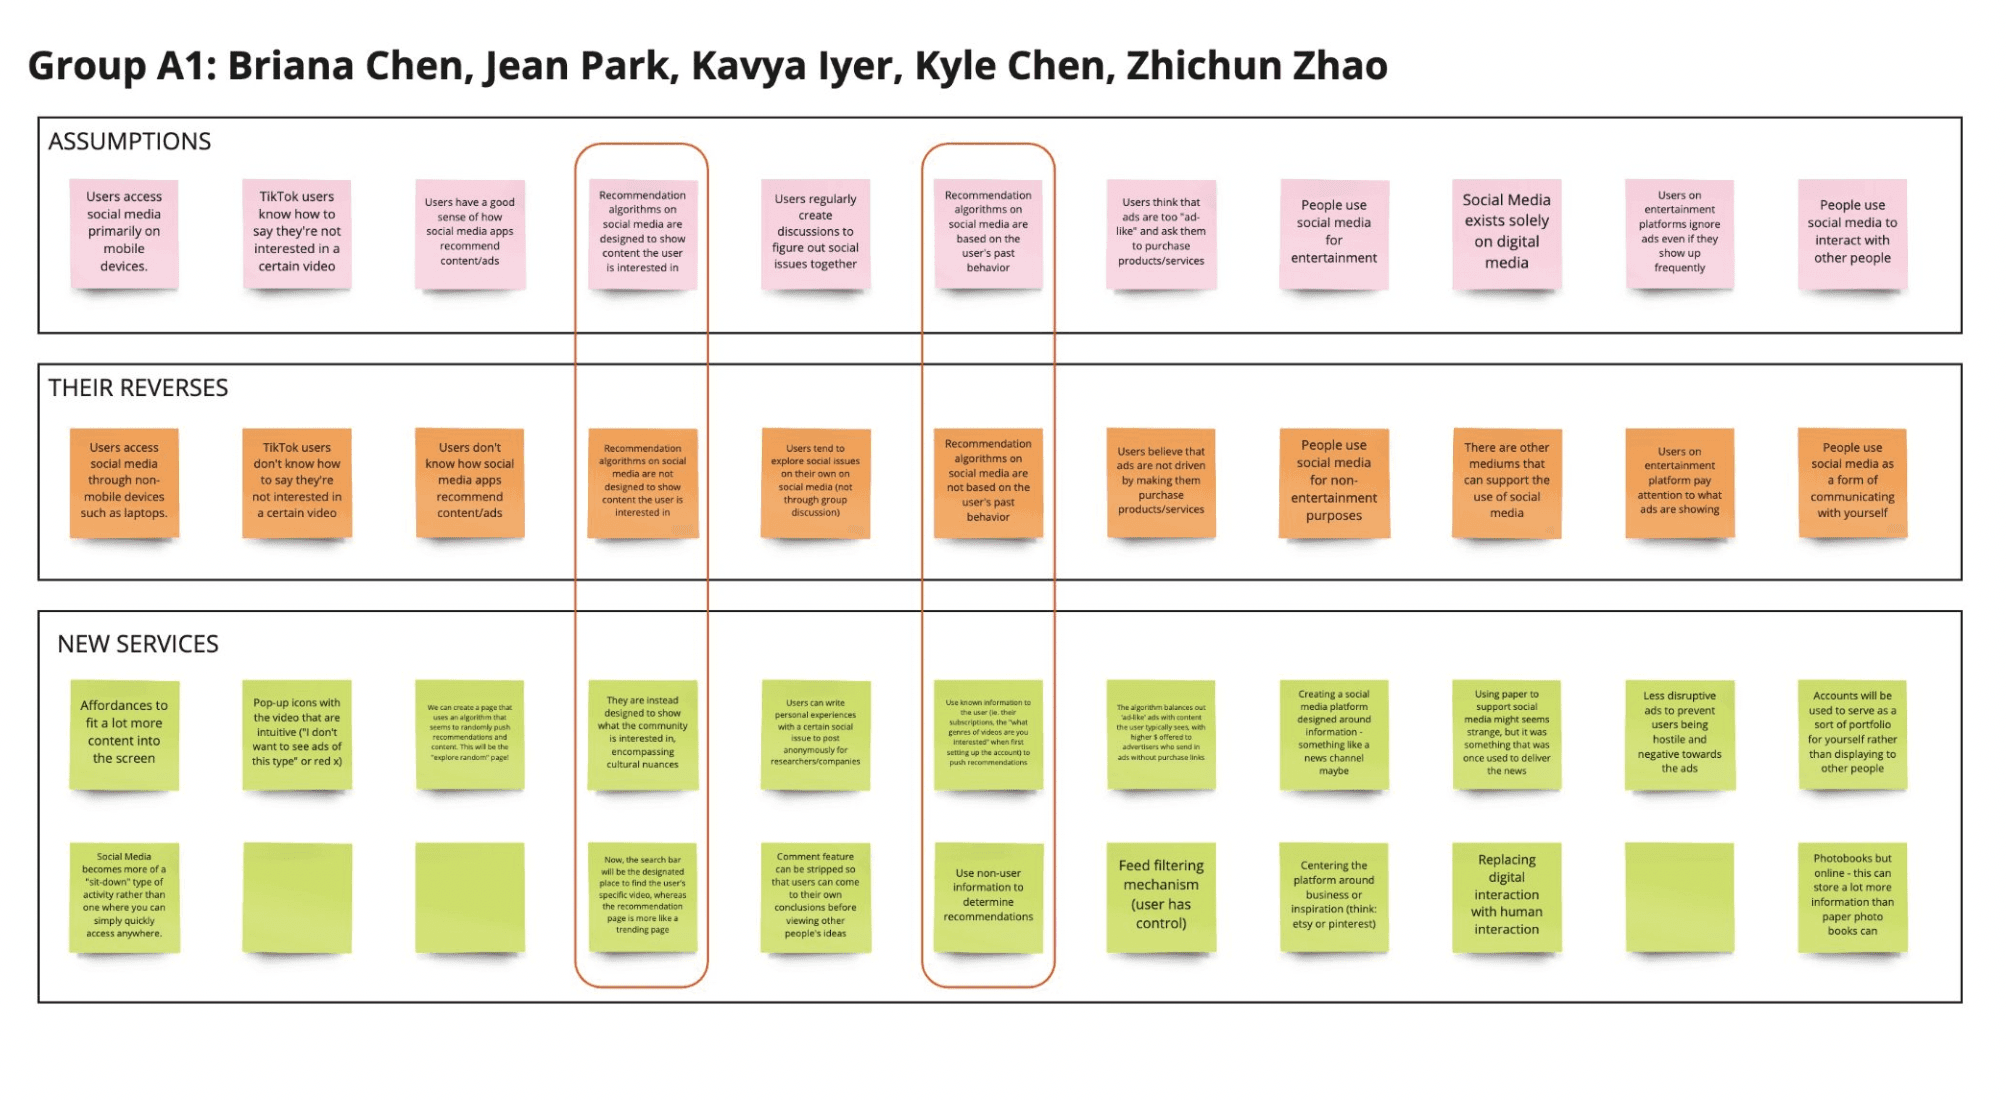
Completing this activity helped us form an area of focus around recommendation algorithms in social spaces:
Offer multiple ways for users to navigate the platform
Implement toggles/filters that sort content by less biased metrics other than viewing history
Designate pages to community trends vs. user’s own recommendations page
Based on this, we created the following research question: How might we give more agency to the user and the content they want to consume on media?
Research
Journal Studies/Contextual Interviews
We had completed our background research and specified our research question, so now we moved onto collecting actual data related to our research question. I suggested the journal study method to the group because it would allow for us to get the most context from the participants. Additionally, participants completed the journal study in their home environment on their own time, so it was as representative of their natural behavior as possible. I also suggested focusing specifically on Instagram because we had not encountered too much background research looking into Instagram’s recommendation algorithm specifically and most students use the app, so I thought it would be interesting to look into.
Participants: Our group of five (5) participants were college-aged students, a demographic we believed were the most enmeshed in the social media (specifically Instagram) realm. In addition to Instagram, many of them engaged also with other social media platforms such as YouTube and TikTok. Their interests and demographics were diverse, spanning from food content to music/dance.
Research Goals: Our journals and interviews aimed to understand how users interact with their Instagram feeds, whether certain actions taken by users have an influence on the Instagram recommendation algorithm, if users understand how their actions affect what is shown on their Instagram feed and whether there is bias in Instagram’s recommendations.
Journal Study Task: Participants were asked to first identify their current feed content, then the feed they wanted to change it to (i.e. food → dogs). Over one (1) week, they would record entries in a Google Docs table detailing what actions they took to shape their feed (i.e. liking, following).
Contextual Interview (30 min.): We asked participants about perceived & actual control over the algorithm.
Analyzing Results
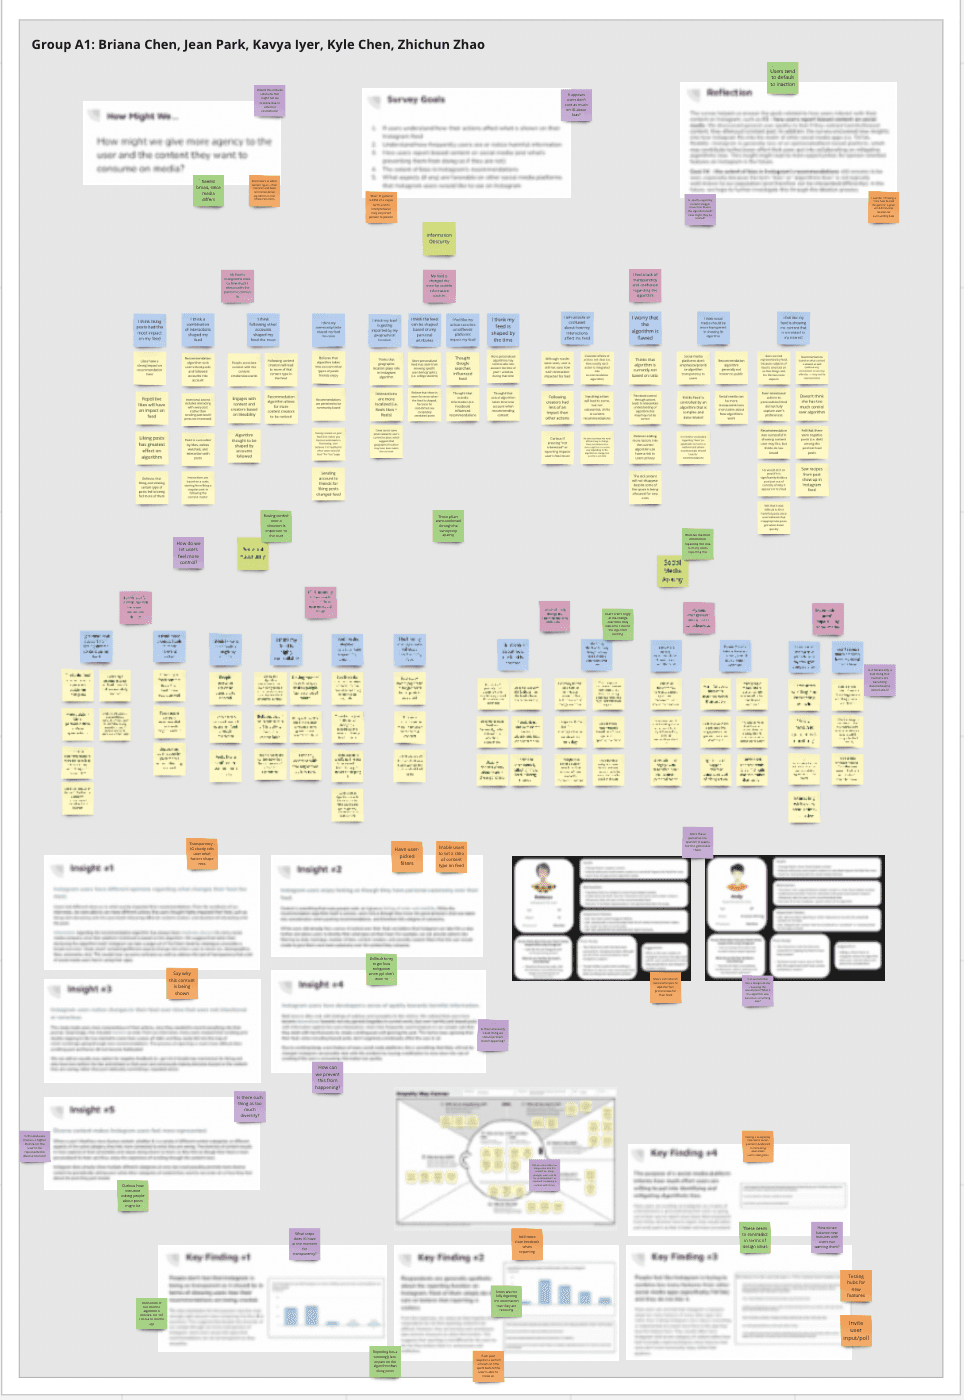
Once we had completed all the journal studies and contextual interviews, we had to figure out a method to sort through our notes and create insights, so we decided to create an affinity diagram.
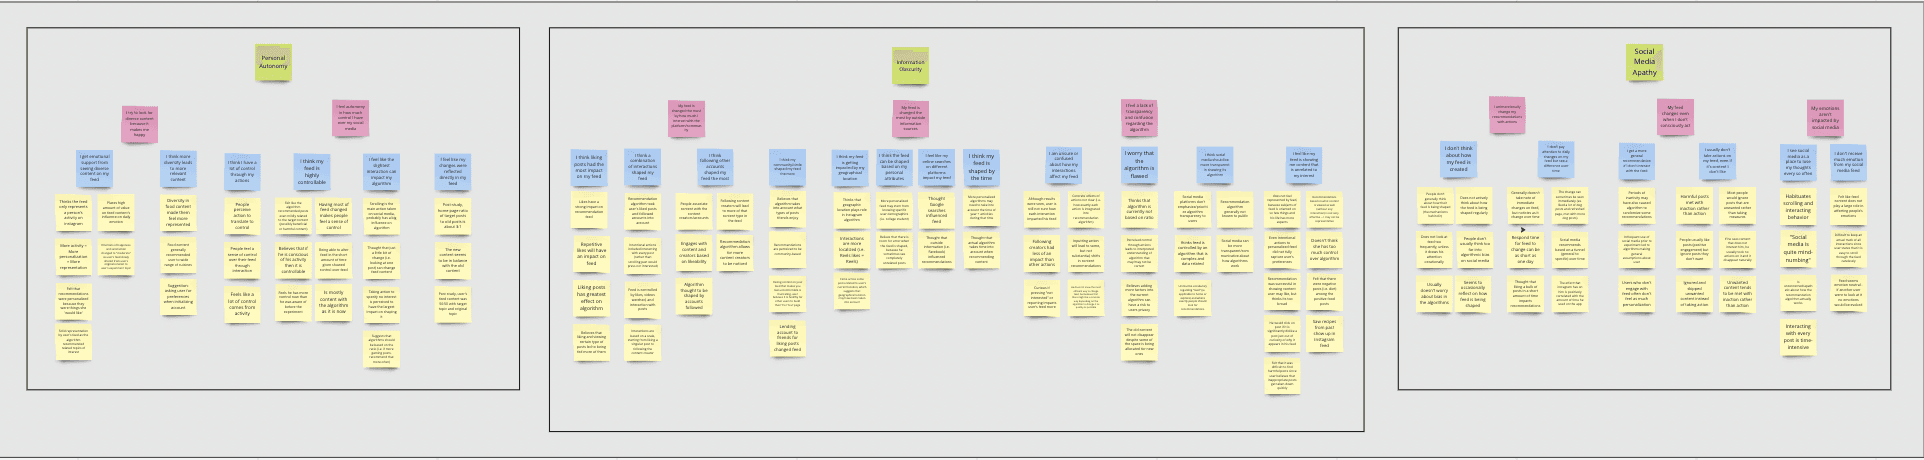
From this process, we generated 5 main insights:
Instagram users have different opinions regarding what changes their feed the most.
Users had different ideas as to what exactly impacted their recommendations.
Instagram users enjoy feeling as though they have personal autonomy over their feed.
Control is something users seek as it gives a feeling of order a stability.
Instagram users notice changes in their feed over time that were not intentional or conscious.
Many users realized that scrolling and double-tapping to like has started to come from a place of habit, and they easily fell into the trap of mind-numbingly going through new recommendations. The process of reporting is much more difficult than scrolling past and hence did not become habituated.Instagram users have developed a sense of apathy towards harmful information.
Instagram users have developed a sense of apathy towards harmful information
Users have become desensitized towards not only general tragedies in current events, but even harmful and biased posts with information against the users themselves. Users that frequently used Instagram in our sample said that they dealt with harmful posts by simply scrolling past and ignoring the post. This led to many agreeing that their feed, when including biased posts, don’t negatively emotionally affect the user at all.
Diverse content makes Instagram users feel more represented.
When a user’s feed has more diverse content, whether it is a variety of different content categories or different aspects of the same category, they feel more connected to what they are seeing.
Understanding Results
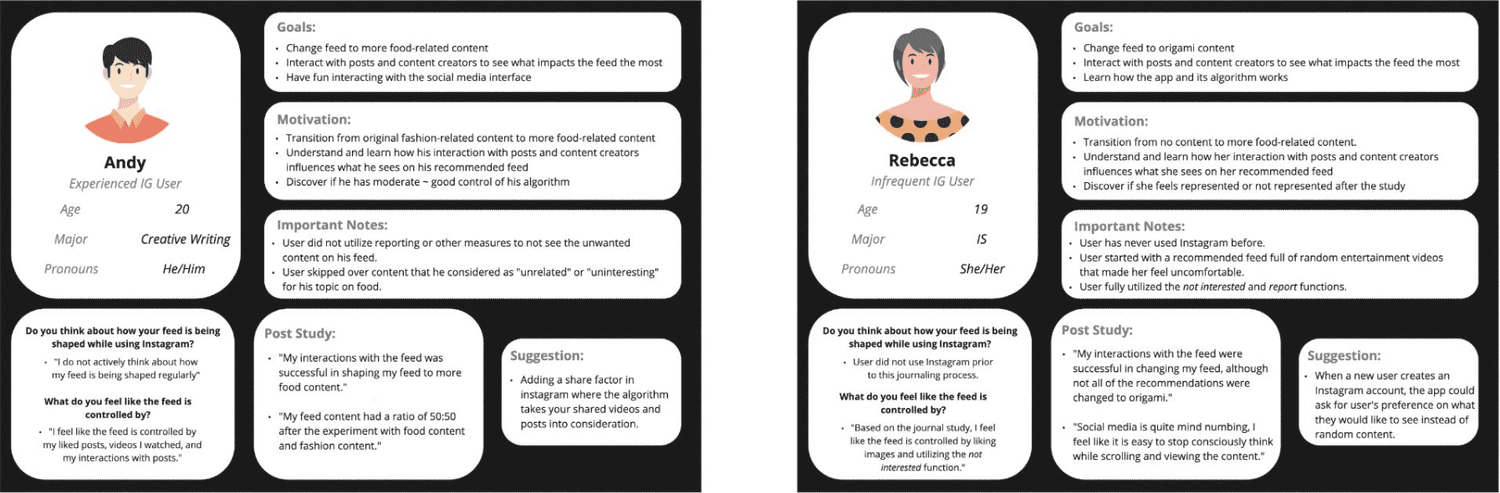
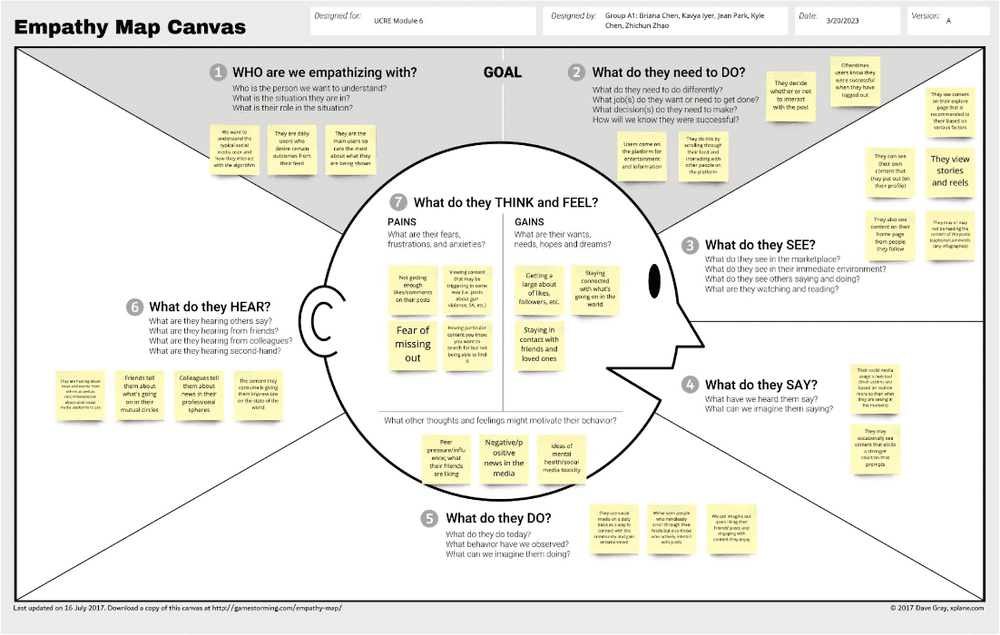
Using these insights, we then created user personas as well as an empathy map to apply them to the situation and understand our target audiences even better. For the user personas specifically, I suggested splitting it by experienced Instagram users and infrequent Instagram users since those were the two main groups we had in our journal study.
Survey
We generated our insights based on our findings from the journal studies and contextual interviews, but this was a very small sample (only 5 users). In order to understand how well these insights applied to a larger audience, we sent out a survey to members of our target audience. Before sending it out to all potential participants, we ran a small pilot test to get feedback regarding the wording, content, and length of the survey to get the best results.
Based on a total of 48 responses to the survey, our key findings were as follows:
People don’t feel that Instagram is being as transparent as it should be in terms of showing users how their recommendations are being created.
Respondents are generally apathetic about the reporting function on Instagram. Most of them simply do not care or believe that reporting is useless.
People feel like Instagram is trying to combine too many features from other social media apps (specifically TikTok) and they do not like it.
The purpose of a social media platform informs how much effort users are willing to put into identifying and mitigating algorithmic bias.
Speed Dating
Wall Walk:
Before continuing on, we conducted another wall walk, since we had new research materials from the last few activities. During our wall walk session, we generated insights, needs, design ideas, and questions that we used to further inform our speed dating sessions and ideation process. We generated both insights and potential design ideas.
Main insights: Users use social media platforms in a more inactive manner, contributing to general apathy and a need for more pronounced feedback.Users want to feel a sense of control over what they see/interact with on social media.Users are unaware of the extent of their actions on their experience.
Design ideas: Allow users to filter by interests and types of content they want to see.Increase awareness of biases through rating systems and/or transparency information hubs/pages. Invite more user engagement through polls and quizzes.Add more distinct feedback for user actions so they can trace action to result.
Crazy 8's:
Now that we had refreshed our memory regarding all our findings so far and started brainstorming, we moved onto crazy 8’s, where we each rapidly drew out 8 different design ideas. After we each did so, we collectively decided on what particular need the storyboard was trying to address on the Miro board.
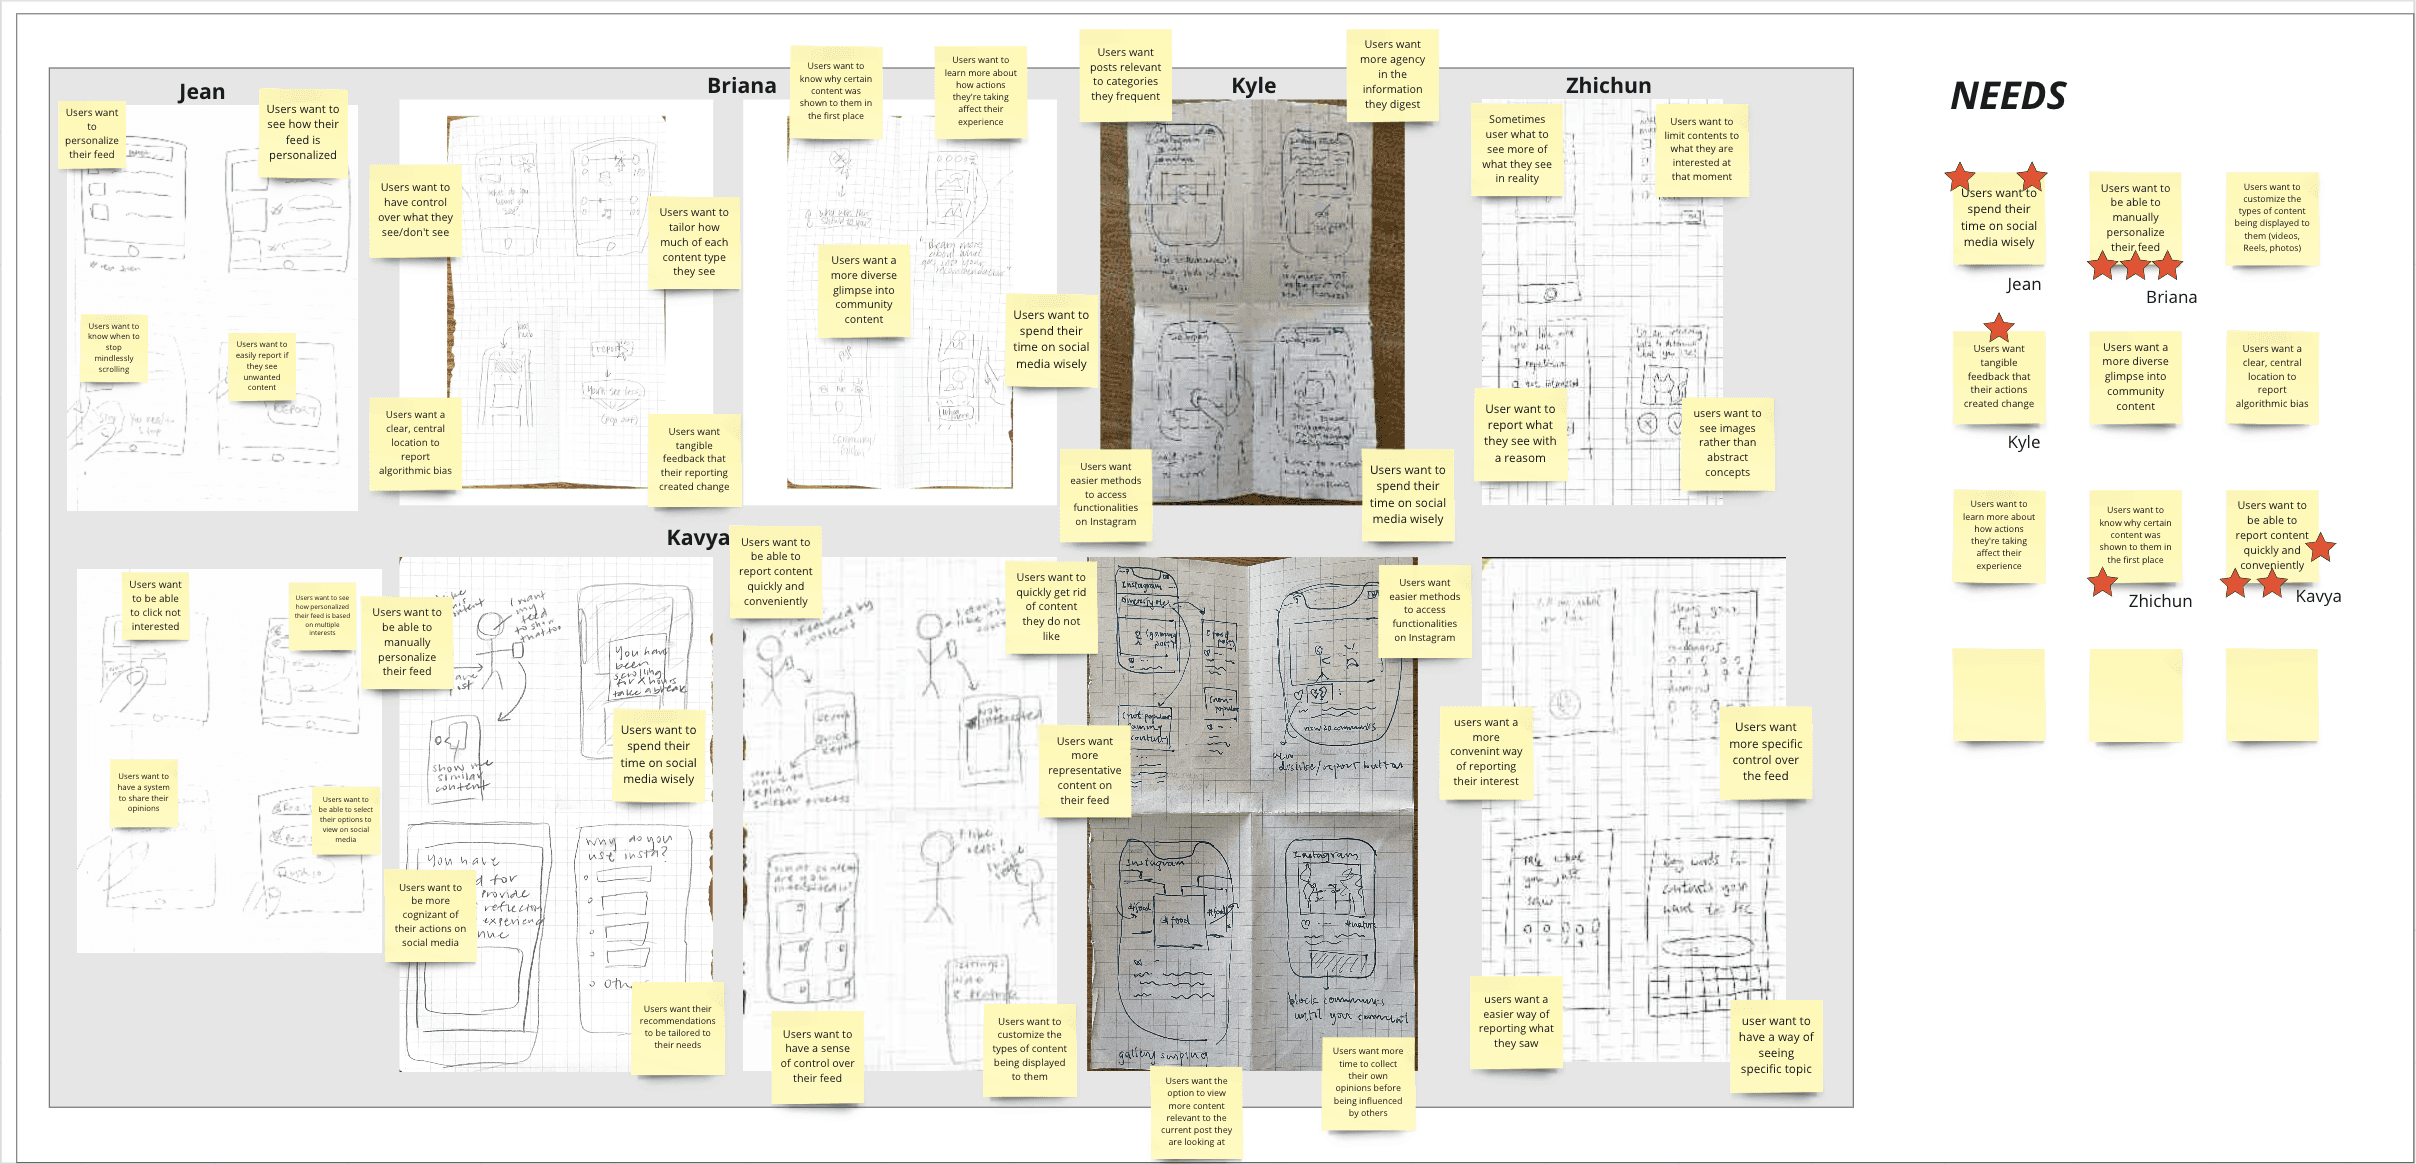
We used this process to generate multiple user needs. Each team member voted for two needs they believed were important to address. We then randomly assigned 5 top-priority needs to different group members to create storyboards.
The needs we picked were as follows:
Users want to be able to manually personalize their feed
Users want tangible feedback when their actions create change.
Users want to spend their time on social media wisely.
Users want to be able to report content quickly and conveniently.
Users want to know why certain content was shown to them in the first place.
Storyboards:
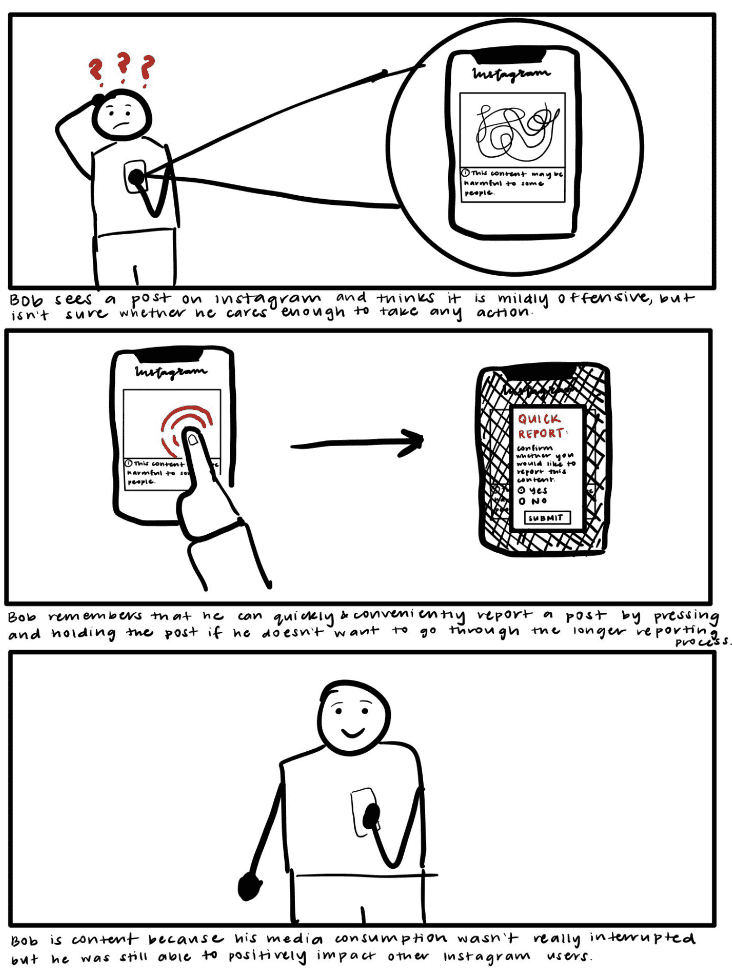
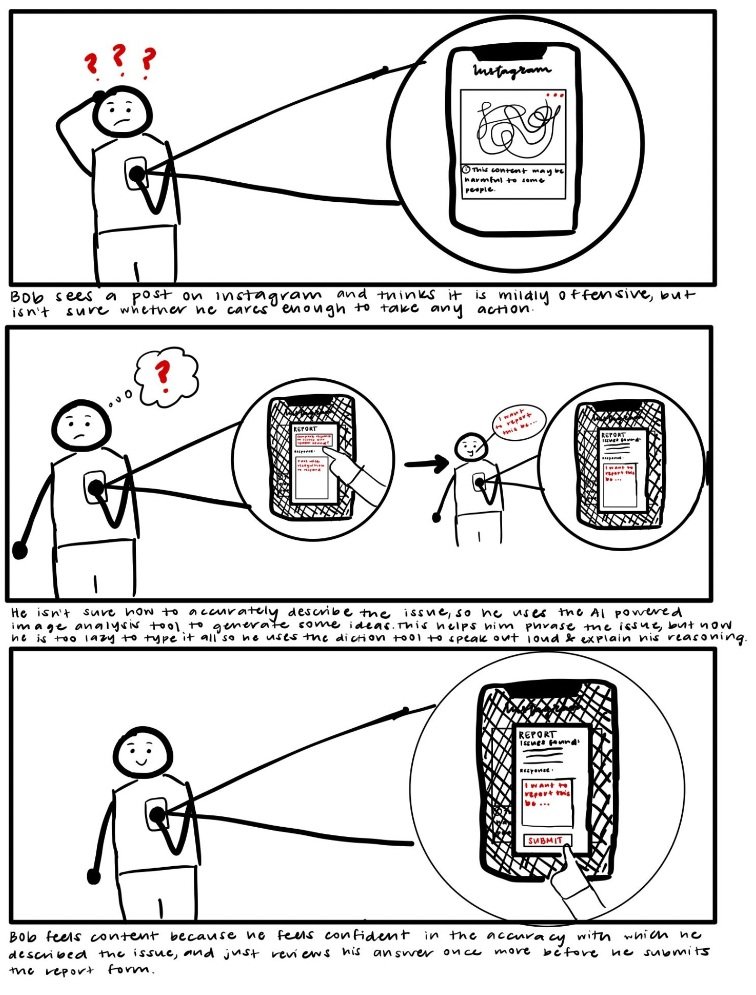
The need that I was in charge of storyboarding was User Need #4: Users want to be able to report content quickly and conveniently. I created three different storyboards involving increasingly risk design ideas.
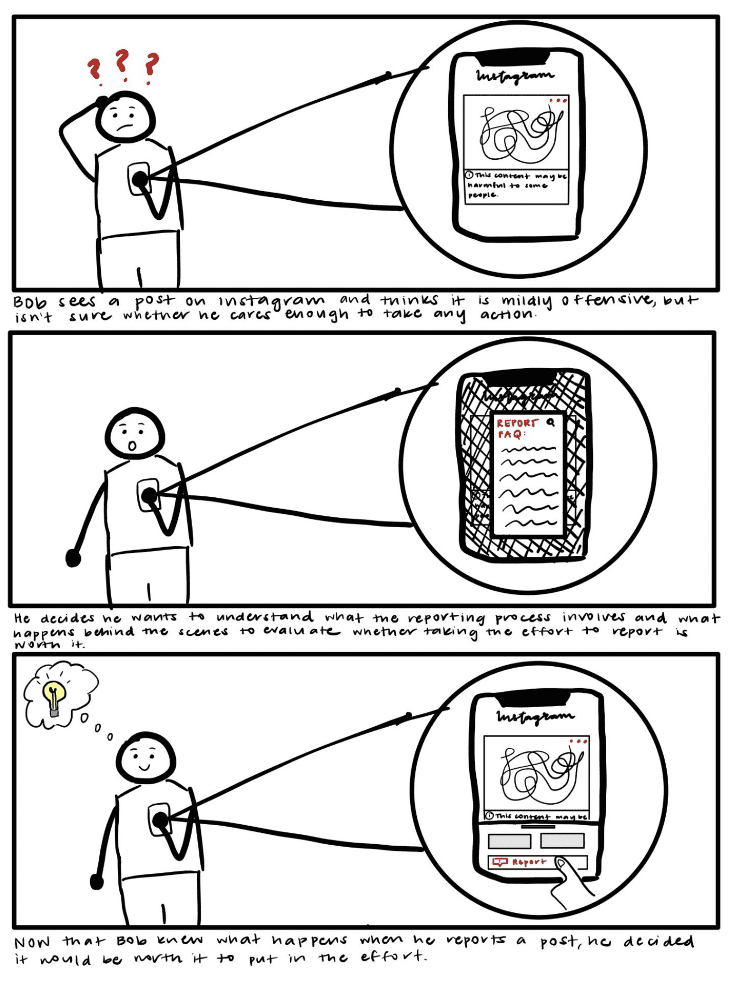
After all the team members created their three storyboards for their respective user need, we compiled them into one presentation to conduct our speed dating sessions. We each conducted one speed dating session where we presented the interviewee all of the 15 storyboards. We randomized all the storyboards so that when the needs and increased levels of risk were interspersed throughout. When showing each user the storyboard, we began by asking a leading question, reading the storyboard out loud to the participant, then discussing their thoughts on each one. We then asked probing questions, pointed out tradeoffs or negatives to the concept, compared the different solutions to each other, and had the participant rank the solutions.
Insights
It’s hard to encourage users to report content, but adding feedback will lessen confusion.
Users appreciated get a separate notification telling them what their reporting did. However, general social media apathy and caring enough about content hinders reporting motivations. It was also discovered that the need for reporting (Need #4) was less significant than other needs.
People value customizing their feed through tangible options.
Users enjoyed personalizing their feed by content type and other toggles because it gave them a greater sense of control. It was also discovered that the need for manually personalizing the feed (Need #1) generally ranked as the most important out of all the other needs.
Although it is difficult to encourage users to regulate their time on social media, most users want to have better discipline.
Through leading questions and points of discussion, it was discovered that most of the users tend to lose track of their time. While they admit that they lack discipline and require better self control, most of them believe that certain scenarios are not effective because users could simply ignore and move on.
People want to change their behavior in theory, but may not necessarily enjoy features that hold them accountable.
Many users say they want to regulate the time they spend on social media, but when it comes to adding features like time-limits, they said that would annoy them or be ineffective in preventing them from continuing their behavior.
Common Misunderstandings
We overestimated the extent to which users wanted to know why content was shown to them in the first place. Rather, users tended to prefer knowing about what data is being collected and what it’s being used for, although greater transparency was still a nice-to-have.
We assumed that the length/effort of the reporting process was what caused users to not report as much. In reality there was a greater cause stemming from social media apathy and the fact that people use the platform as a getaway/mindless option so they don’t feel the moral obligation to do so.
We overlooked the fact that there were many overlaps in our storyboards with other features, such as following content creators and how holding a post might cause confusion/errors in conjunction with the double-tapping to ‘like’ feature.
Validated Design Needs/Ideas
Users want to be able to manually personalize their feed. With a greater sense of control, they are able to curate the content they’re being shown on a daily basis.
Users want tangible feedback when their actions create change. To know what their actions are being translated into, users want to see some type of response on social media so they may do it again.
Users appreciate transparency. Having a hub where users can understand how/why information is displayed to them was valued, but they do not want to constantly be reminded of it.
Users want to have better discipline of their usage on social media. In order to not lose track of time on social media, users want a sure-fire method to manage their time wisely.
Design Opportunities
Customization settings can be implemented to allow the user to personalize their content type and frequency. There can also be a default option for those who want to rely on the algorithm as is.
Implementing delayed feedback in the case of reporting mechanisms can give users a sense of community and helpfulness. It also mitigates the confusion as to whether or not their reporting is really working.
Having a quick report increases ease of accessing the report feature, making it as easy to report and like content.
Priority setting could be applied to strictly show the important posts of the day. This will reduce the user’s time spent on posts/content, decreasing the number of posts to view but maintaining the level of fulfillment gained from consuming media.
Design
Paper Prototype
Creating a Plan:
Based on our speed dating sessions, we came up with multiple potential design opportunities that we could potentially prototype. After much discussion, we decided to create & test a prototype for customization settings (including content type filters, ratios for content on the feed, toggling of features, etc.) because it was the most significant need that came up for users. We decided that we would test on college-aged participants who had past experiences with social media and technology using a paper prototype.
We also wanted to implement measures to get additional feedback outside of the testing session, so we decided to use a customer satisfaction survey to test the subjective benefit from people using the customization settings to tailor their feed, and how actively they would use it if implemented and a System Usability Scale (SUS) to test the ease of usability for the customization prototype.
Customer satisfaction survey: High #’s = success, low #’s = failure
Above average SUS score of 68 = success
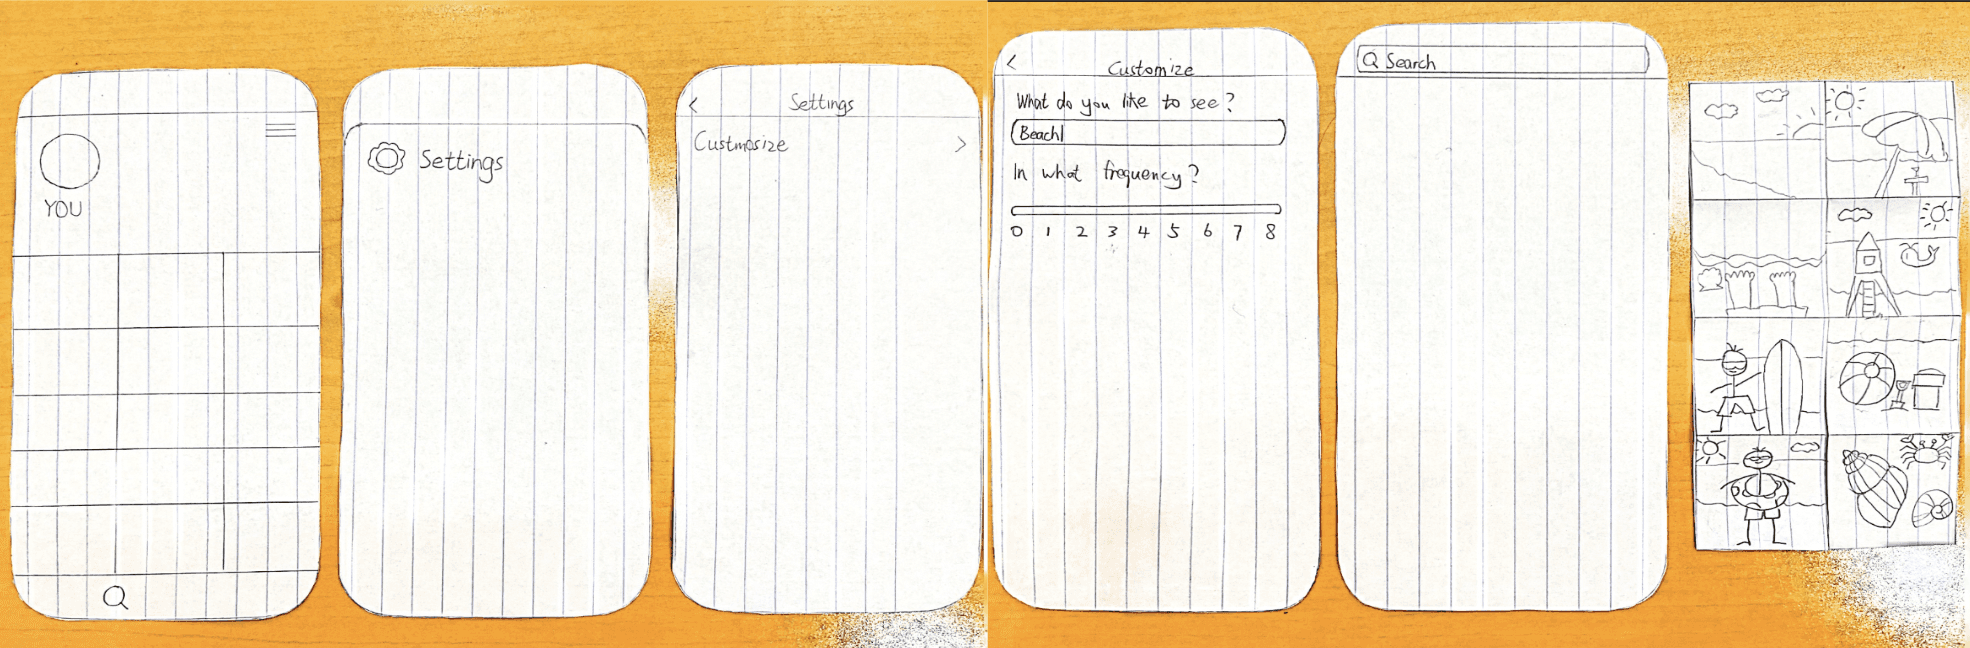
Creating the Prototype:
We created a paper prototype due to the ease of observing quick feedback in the participant and screen. We decided to opt for this because the user can directly interact with the mobile device rather than on a laptop in Figma (which would not be representative of the proposed feature). This will test assumption #1 (users report content because they feel it doesn’t have a place in their feed) by measuring if changes in customization correlate to expressed preferences for/against reporting. For assumption #2, this will test what settings matter most to users in customizing their experience.
We all collaboratively came up with the tasks for the prototype test before creating the actual prototype so we could make sure the prototype had all the necessary features for the tasks.
The tasks are outlined below:
Navigate to the customization page
Users will start by trying to navigate to the customization feature from their home page. This will live with the other user settings found in their profile.
Interact with the customization features
Users will adjust features to their liking (sliders, buttons, selections)
Observe the change in feed
Users will navigate back to their home page to observe the change.
Validation
User Testing
We tested our prototypes with 10 participants (2 per person) in person with paper prototypes. Due to the ‘ideal’ feed of our paper prototype being related to the beach, we screened our participants through recruiting people who like the beach to more accurately identify the extent of positive affect on them after the customization settings were introduced. These were college-aged individuals who were reasonably well-acquainted with social media/Instagram. Each session lasted 10-20 minutes and included note-taking, consent scripts, and an interview script.
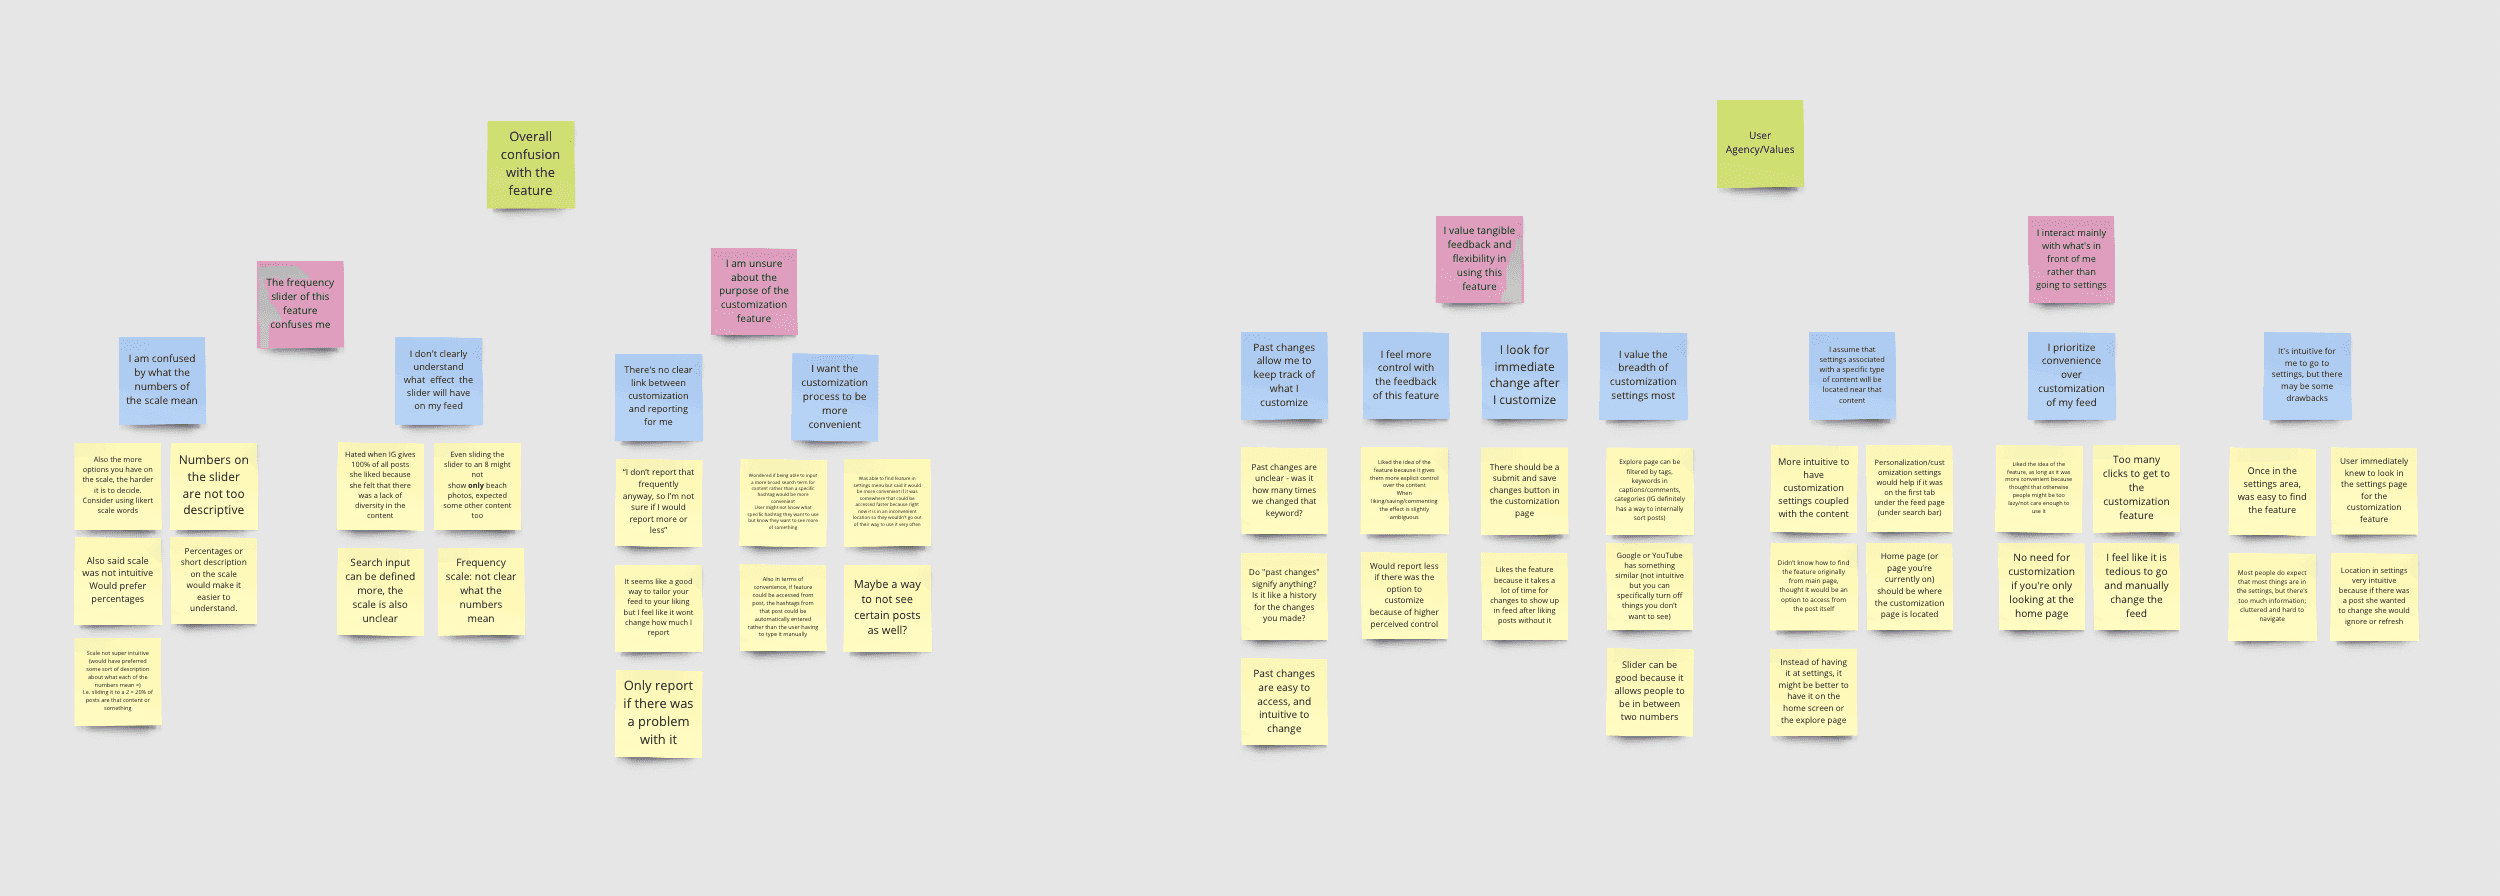
Analyzing
After completing all the tests, we compiled all the notes from each of our respective sessions and created an affinity diagram to find trends within our data and generate insights.
Success/Failures
Successes
From the user satisfaction survey responses, we learned that users liked the thought process behind the feature because they appreciated the explicit control it gave them.
Failures
From the SUS survey responses, we learned that users thought our feature was somewhat inconvenient to access/use, which might decrease their usage.
Proposed Changes
Goal: decrease the amount of bias people are potentially exposed to by giving the user control to determine what they want to see
Consider different metric (not 0-8); instead, use words (low frequency, not at all, high frequency, etc.)
Differentiate the point when users start feeling negative (ex. -5 to 5, colors red vs. green, neutral) to make it more intuitive what changes this will bring to the feed
Location: on the post itself, adding an extra option may be more intuitive (coupling with location)
Add a list of hashtags users have looked up and changed before + what frequency they’re at currently
Can delete all to return to normal Instagram
Revisions
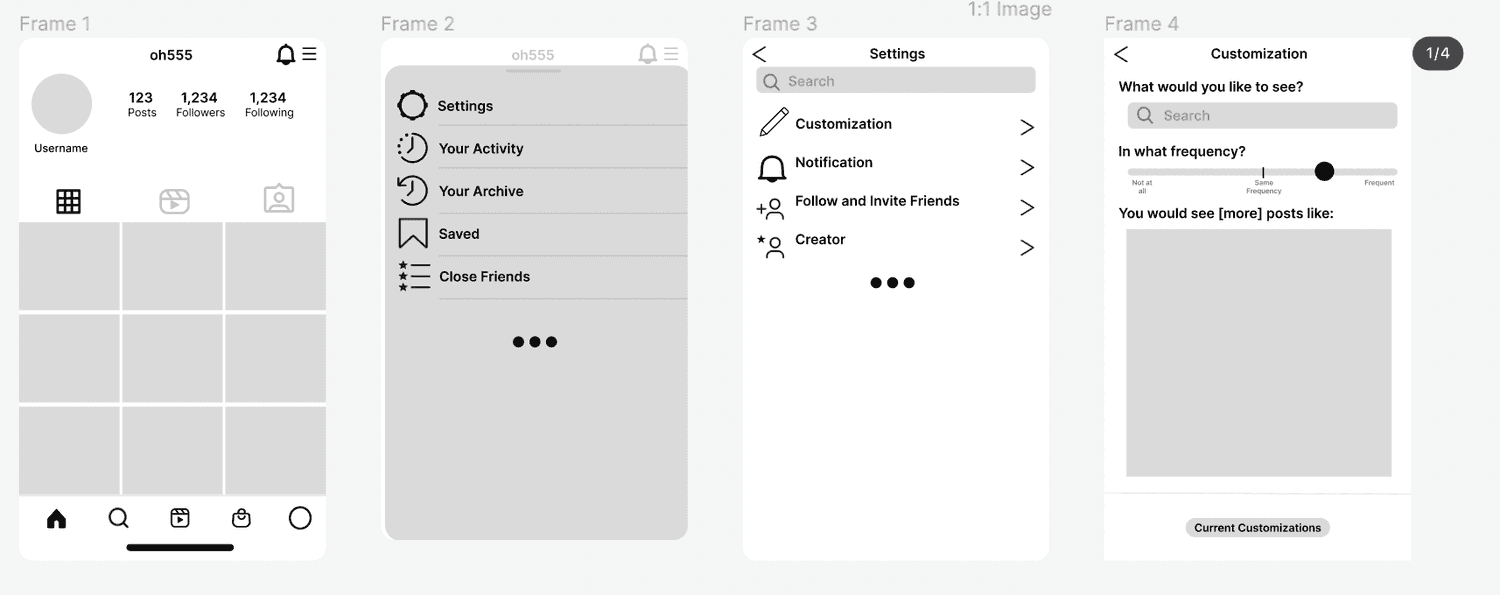
Mid-Fi/Hi-Fi Prototypes
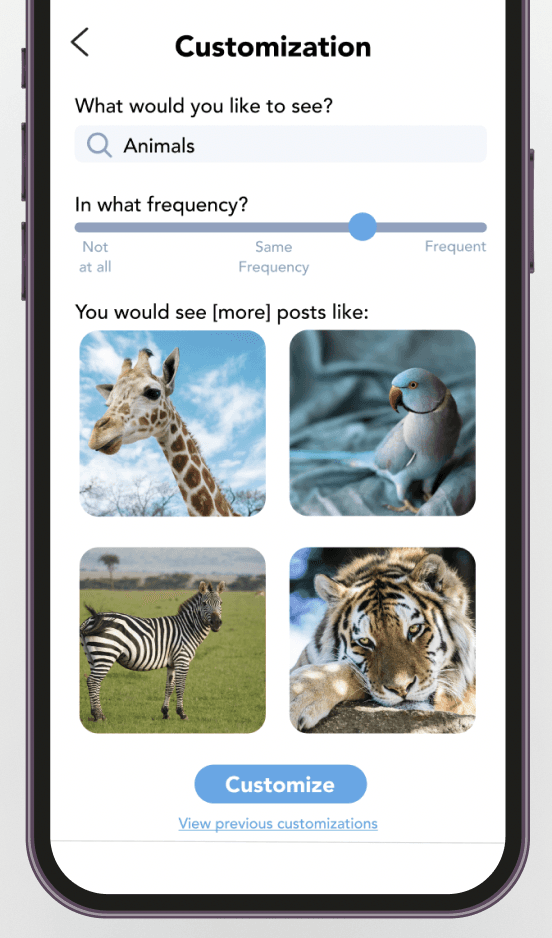
We implemented some of the proposed changes into our final mid-fi and hi-fi prototypes, as seen below. Specifically, we changed the metrics on the slider to not be numeric.
Next Steps
In the future, we would also create a prototype for the page to see all the prior hashtags that the user has looked up and consider different options for the location of the feature. We would continue to refine our digital prototype and conduct more testing sessions with the updated, interactive version. Conducting these sessions would also allow us to get more feedback on the actual design of the feature, since most of our testing and feedback currently was focused on the usability and functionality of the feature.